Introduce the power monitoring software of 3MW photovoltaic power station of Kyushu New Energy Co., Ltd. The system adopts the on-site local networking mode. After networking, it communicates through fieldbus and travels to the background. It realizes the change through the Acrel-2000 V8.0 photovoltaic monitoring system. Management of electricity used in power distribution circuits.
Yang Junjun
Ankerui Electric Co., Ltd., Jiading, Shanghai 201801, China;
0 Overview
The wholly-owned subsidiary of Hubei Kyushu Fangyuan New Energy Co., Ltd. was established in June 2012 with a registered capital of 169 million yuan. The company specializes in the investment, construction, operation, maintenance and management of grid-connected photovoltaic power plants, photovoltaic building integrated power stations, photovoltaic agricultural integrated power stations; production and research and development of photovoltaic integrated lighting systems such as photovoltaic lighting and photovoltaic charging.
Photovoltaic power plants must be equipped with an automatic, fully functional monitoring system. This kind of monitoring system is different from the traditional power plant monitoring system or the substation integrated automation system. Relatively speaking, the types of equipment in the photovoltaic power station are not as rich as the traditional power plants, and the production control process is not too complicated. However, its typical features are large installed capacity, wide area, and few maintenance personnel. This requires centralized integration of production operations, equipment monitoring, environmental monitoring, security and technical defense, and can be adapted to its location dispersion and flexible configuration. specialty. Large-scale PV plant monitoring systems based on fieldbus design can meet these requirements.
Since the solar panel power generation parameters are unstable and fluctuating and intermittent, the photovoltaic power generation monitoring system can be used for battery arrays, combiners, inverters, AC and DC power distribution cabinets, solar tracking control systems, etc. in solar photovoltaic power plants. The device is monitored and controlled in real time. The PV power plant PV monitoring system quickly grasps the operation of the power station through various styles of charts and data. Its friendly user interface, powerful analysis functions and perfect fault alarm ensure the complete reliability and stable operation of the solar photovoltaic system.
The project is a 3MW factory roof photovoltaic grid-connected power generation. According to customer needs, our company only needs to monitor the inverter and the combiner box. If customers need to achieve temperature, humidity, illuminance, wind direction, wind speed analog acquisition, an environmental monitor can be installed.
The project has 5 inverters and 41 combiner boxes. There are 4 inverters in the factory area, 33 confluence boxes are distributed in the 1# factory house surface, 2# factory house surface, warehouse roof, and the monitoring room is next to the inverter room. The International Trade Building has one inverter, eight confluence boxes are distributed on the roof of the building, and the monitoring room is on the first floor of the building.
Acrel-2000 V8.0 low-voltage intelligent power distribution system makes full use of the latest developments of modern electronic technology, computer technology, network technology and fieldbus technology, and performs distributed data collection and centralized monitoring and management of variable power distribution systems. The secondary equipment of the power distribution system is networked, and the field devices of the distributed power distribution stations are connected as an organic whole through the computer and the communication network to realize remote monitoring and centralized management of the power grid operation.
1 System structure description
The project has 5 inverters and 41 combiner boxes. There are 4 inverters in the factory area, 33 confluence boxes are distributed in the 1# factory house surface, 2# factory house surface, warehouse roof, and the monitoring room is next to the inverter room. The International Trade Building has one inverter, eight confluence boxes are distributed on the roof of the building, and the monitoring room is on the first floor of the building.
The monitoring system adopts a layered distributed structure, namely, station control layer, communication layer and interval layer; the plant network is as shown in the following figure (1):
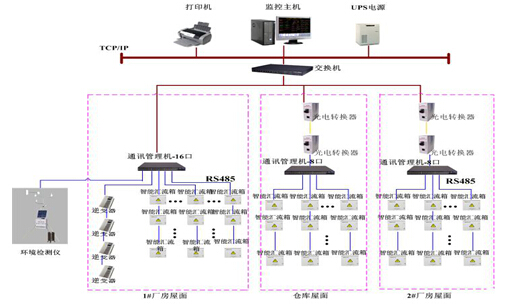
figure 1)
The international trade network is shown in the following figure (2):
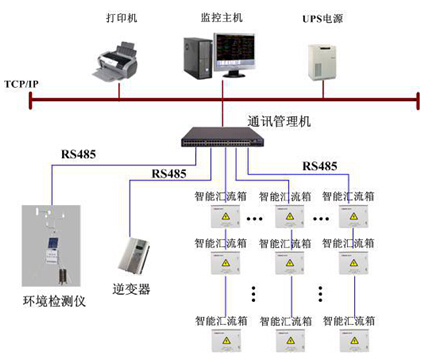
figure 2)
The interval device layer is mainly: inverter, combiner box, environmental monitor, and the like. These devices are respectively installed in the electrical cabinet corresponding to the corresponding primary equipment. These devices all adopt RS485 communication interface, and realize on-site data collection through the on-site MODBUS bus networking communication.
The network communication layer is mainly: communication server, its main function is to collect the scattered devices in the field, and remotely transmit to the station control layer to complete the data interaction between the field layer and the station control layer.
Station control management: equipped with high-performance industrial computers, monitors, UPS power supplies, printers, alarm buzzers and other equipment. The monitoring system is installed on the computer to collect and display the running status of the field device and display it to the user in the form of human-computer interaction.
The above network instruments adopt RS485 interface and MODBUS-RTU communication protocol, RS485 adopts shielded line transmission, generally adopts two connections, the wiring is simple and convenient; the communication interface is half-duplex communication, that is, both sides of the communication can receive and send data but Only data can be sent or received at the same time, and the maximum data transmission rate is 10Mbps. The RS485 interface is a combination of balanced driver and differential receiver. It has enhanced noise immunity and allows up to 32 devices to be connected on the bus with a maximum transmission distance of 1.2km.
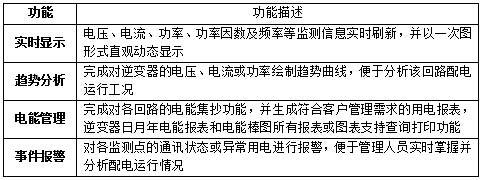
2 main functions of photovoltaic monitoring system
2.1 Data Acquisition and Processing
Data collection is the basis of power distribution monitoring. Data acquisition is mainly completed by the underlying multi-function network instrument, realizing local real-time display of remote data. The signals that need to be collected include: inverter phase voltage U, phase current I, frequency Hz, power P, power factor COSφ, electrical EPI, and other data, combiner box voltage, current, etc., environmental monitor temperature, humidity , wind speed, wind direction, illuminance, etc., remote device operating status and other data.
The data processing mainly displays the electric parameters collected as required in real time to the user, and achieves the automation and intelligent requirements of the power distribution monitoring, and simultaneously stores the collected data into the database for the user to inquire.
2.2 Human-computer interaction
The system provides a simple, easy to use, and good user interface. Using the full Chinese interface, the CAD graphic shows the electrical main wiring diagram of the low-voltage power distribution system, showing the status of the power distribution system equipment and the corresponding real-time operation parameters; real-time dynamic refresh of the screen; analog quantity display; switch quantity display; continuous record display.
2.3 Diachronic events
The diachronic event viewing interface mainly provides convenient and friendly human-computer interaction for the user to view the fault records, signal records, operation records and over-limit records that have occurred. Through the historical event viewing platform, you can conveniently locate you according to your own requirements and query conditions. The historical events to be viewed provide good software support for you to grasp the operation of the entire system.
2.4 Database Establishment and Query
It mainly completes remote measurement and remote signal timing collection, and establishes a database to generate reports on a regular basis for users to query and print.
2.5 User Rights Management
For different levels of users, set different permission groups to prevent the loss of production and life caused by human error, and achieve safe and reliable operation of the power distribution system. Users can log in, log out, change passwords, add deletes, etc. through user management, which is convenient for users to modify accounts and permissions.
2.6 Operating load curve
The load trend curve function is mainly responsible for timing the incoming line and important loop current and power load parameters, and automatically generating the running load trend curve, which is convenient for the user to know the running load status of the equipment in time. Click the corresponding button or menu item to complete the function switching; you can view the real-time trend curve or historical trend line; you can perform translation, zoom, and range conversion on the selected curve to help users enter the line.
Potential analysis and fault recollection provide intuitive and convenient software support for analyzing the health of the entire system.
2.7 Remote Report Query
The main function of the report management program is to design the report style according to the needs of the user, and filter the data processed in the system to generate the report data required by the user. The program can also use the timed save, print or summon save and print mode for the report file according to the user's needs. At the same time, the program also provides users with the function of generating report file management.
The report has the function of freely setting the query time to realize the energy statistics, data export and report printing of day, month and year.
3 Case analysis
3.1 Customer requirements
The project has 5 inverters and 41 combiner boxes. There are 4 inverters in the factory area, 33 confluence boxes are distributed in the 1# factory house surface, 2# factory house surface, warehouse roof, and the monitoring room is next to the inverter room. The International Trade Building has one inverter, eight confluence boxes are distributed on the roof of the building, and the monitoring room is on the first floor of the building.
Customer-supplied distribution monitoring requirements table:
Customer's requirements for the report: report on the current, voltage, power, power factor and ambient temperature and humidity of the inverter output and input rate and support the query of historical data printing function. The inverter's solar energy is in the form of a bar graph. display.
3.2 Software implementation function for this project
The monitoring points in this project are widely distributed and adopt fiber-optic networking to reduce interference in data transmission.
The PV array monitoring function mainly completes the monitoring of each combiner box, single DC current, PV voltage, PV total current, and combiner box temperature, and the operation status of each combiner box, and performs abnormal display and alarm prompt for the fault point. As shown in Figure (3)
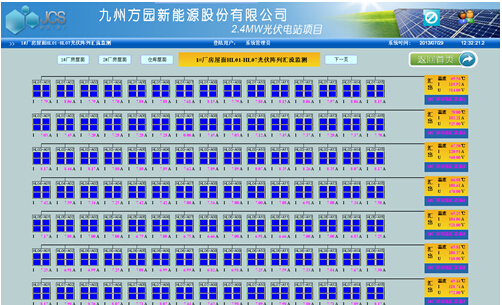
Figure (3) Photovoltaic array monitoring
The alarm event is mainly used to view the current limit information and the communication connection information of the combiner box, the inverter and the environmental monitor; to help the user to make an accident query; to support historical query, printing and other functions. If there is any main line loop current limit, communication interruption and connection, the real-time alarm information will prompt which circuit which phase current and circuit name will be displayed in time, and this window will pop up automatically until the attendant confirms or clears the alarm. The alarm will stop. As shown in Figure (4)
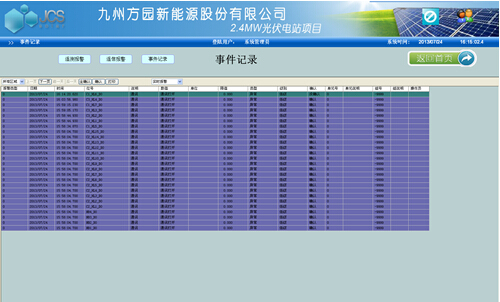
Figure (4) Historical telemetry alarm information query
The main function of the remote meter reading navigation bar is to view the electrical parameters of all circuits in the substation. Reports can be EXCEL exported or printed. Clicking the remote meter reading button on the main interface will appear as shown in Figure (5). Set the time, you can see the historical data of the corresponding loop by clicking the 1# factory house surface, 2# factory house surface and warehouse roof button. .
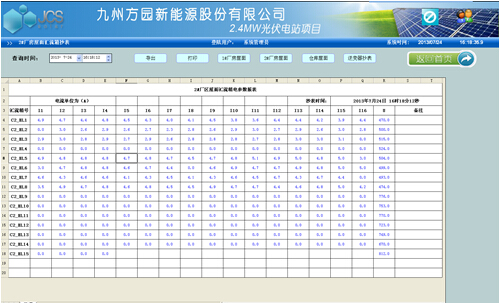
Figure (5) Parameter reading
The main function of the power generation bar graph is: the year, month and day statistics of the power consumption of the four inverters. The report can be EXCEL exported or printed, and the bar graph can only be printed. Taking the daily report as an example, the query of the report can set the query time to query the historical power consumption; for the query of the bar graph, first check the report.
The table is selected by clicking on the corresponding range below the bar graph. As shown in Figure (6)
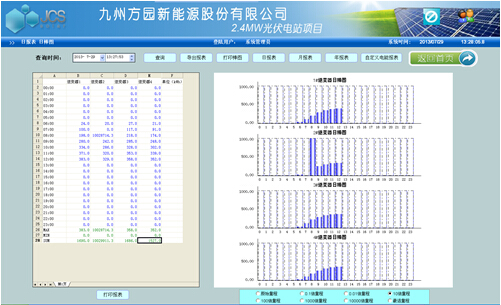
Figure (6) Energy report
The main function of the custom energy report is: view the power consumption of the inverter, and the report can be exported or printed by EXCEL. Clicking on the Custom Energy Report button will appear as shown in Figure (7). You can query the historical power consumption by setting the start and end time of the query. (Note that the total power generation is correct only if there is data for the start and end times of the inverter in the report.)
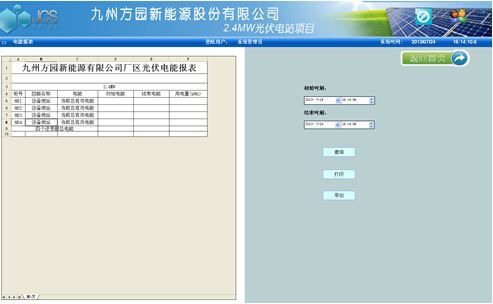
Figure (7) Custom report
The power generation trend and environmental relationship graph are mainly responsible for checking the relationship between the environment and the power of the inverter. The curve can view the real-time trend curve or the historical trend line; help the user to manage the power equipment. The interface curve shows the environmental temperature, ambient humidity, wind direction, wind speed curve of the environmental monitor, as well as the light intensity and the power comparison diagram of the four inverters, the query method of the curve and the inverter curve query in the grid monitoring The same way. On the left is the data report for the environmental monitor. As shown in Figure (8)
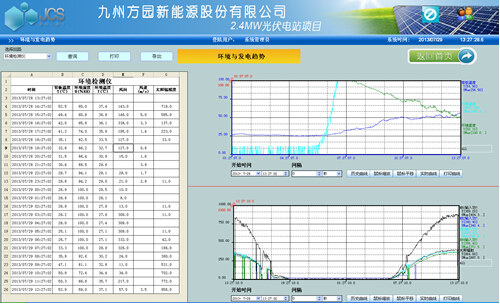
Figure (8) Power generation trends and environmental relationships
The grid-connected monitoring interface is mainly responsible for checking the working condition of the inverter, the active power and reactive power graph of the inverter, the real-time output of the inverter, the input voltage, the current power, the power generation efficiency, and the operating state of the inverter. real-time monitoring. As shown in Figure (9)
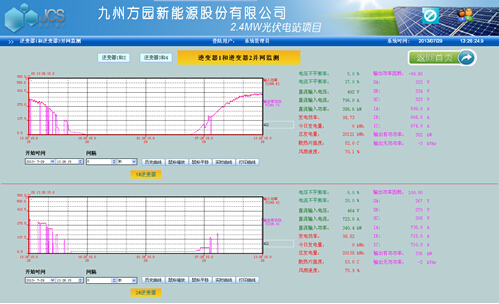
Figure (9) Grid monitoring
4 Conclusion
With the gradual expansion of the domestic PV industry and the gradual upgrading of technology, the cost of photovoltaic power generation will gradually decline, and the domestic PV capacity will increase significantly in the future. China has upgraded its new energy industry to a national strategic industry. In the next 10 years, it plans to increase investment in new energy industries, including solar energy, in order to reduce the economy's dependence on petrochemical energy and reduce carbon emissions. China's photovoltaic power generation is expected to grow in a large scale in the next five to ten years. The application of the Acrel-2000 V8.0 photovoltaic monitoring system in Kyushu New Energy Co., Ltd. 3MW photovoltaic power station can realize real-time monitoring and real-time monitoring of grid-connected power generation of Kyushu New Energy Co., Ltd. 3MW photovoltaic power station, which can not only display The circuit power consumption status also has a network communication function, and can be combined with a serial port server and a computer to form a photovoltaic monitoring system. The system realizes the analysis and processing of the collected data, displays the running status of each inverter and the combiner box of the photovoltaic power station in real time, and has a pop-up alarm dialog box and an alarm sound prompt for the analog switch-on and load-over limit, and generates various energy reports. , analysis of curves, graphics, etc., to facilitate remote meter reading of electricity and electricity analysis and research. The system is safe, reliable and stable, and provides a reliable and reliable basis for the users of the substation to solve the problem of electricity consumption, and has achieved good social benefits. [1]
references:
[1]. Zhou Zhongbian. Product selection and solution for smart grid customer terminal power monitoring and photovoltaic monitoring system [M]. Beijing. Mechanical Industry Press. 2011.10
About the author: Yang Junjun, female, undergraduate. Position: Now working for Ankerui Electric Co., Ltd., contact number, mobile phone, QQ
Http://news.chinawj.com.cn Editor: (Hardware Business Network Information Center) http://news.chinawj.com.cn
Trimethylsilyl Chloride,Insulating Agent,Cas 75-77-4,Min Trimethylsilyl Chloride
Quzhou CanWin New Material Co., Ltd. , https://www.canwinnm.com